
In math, we have been learning how to clearly and effectively display data.
In preparation for our exhibition, we had Mr. Huber, our technology expert, show us how to use Google Form to conduct surveys online. We learned that using this tool, we can not only survey our own class but other classes and the larger school community as well!


Once we collected the results of our survey, we took a look at the video below and discussed
1) how the data was presented
and
2) its effect on the viewer's understsanding.
We then created infographics to display our findings using a variety of objects.
You may ask, "What are infographics?"
Here is the definition we looked at in class:
1. It's a visual explanation that helps you more easily understand, find, or do something.
2. It's visual, and when necessary, integrates words and pictures in a fluid, dynamic way.
3. It stands alone and is completely self-explanatory.
4. It reveals information that was formerly hidden or submerged.
5. It makes faster, more consistent understanding possible.
6. It's universally understandable.

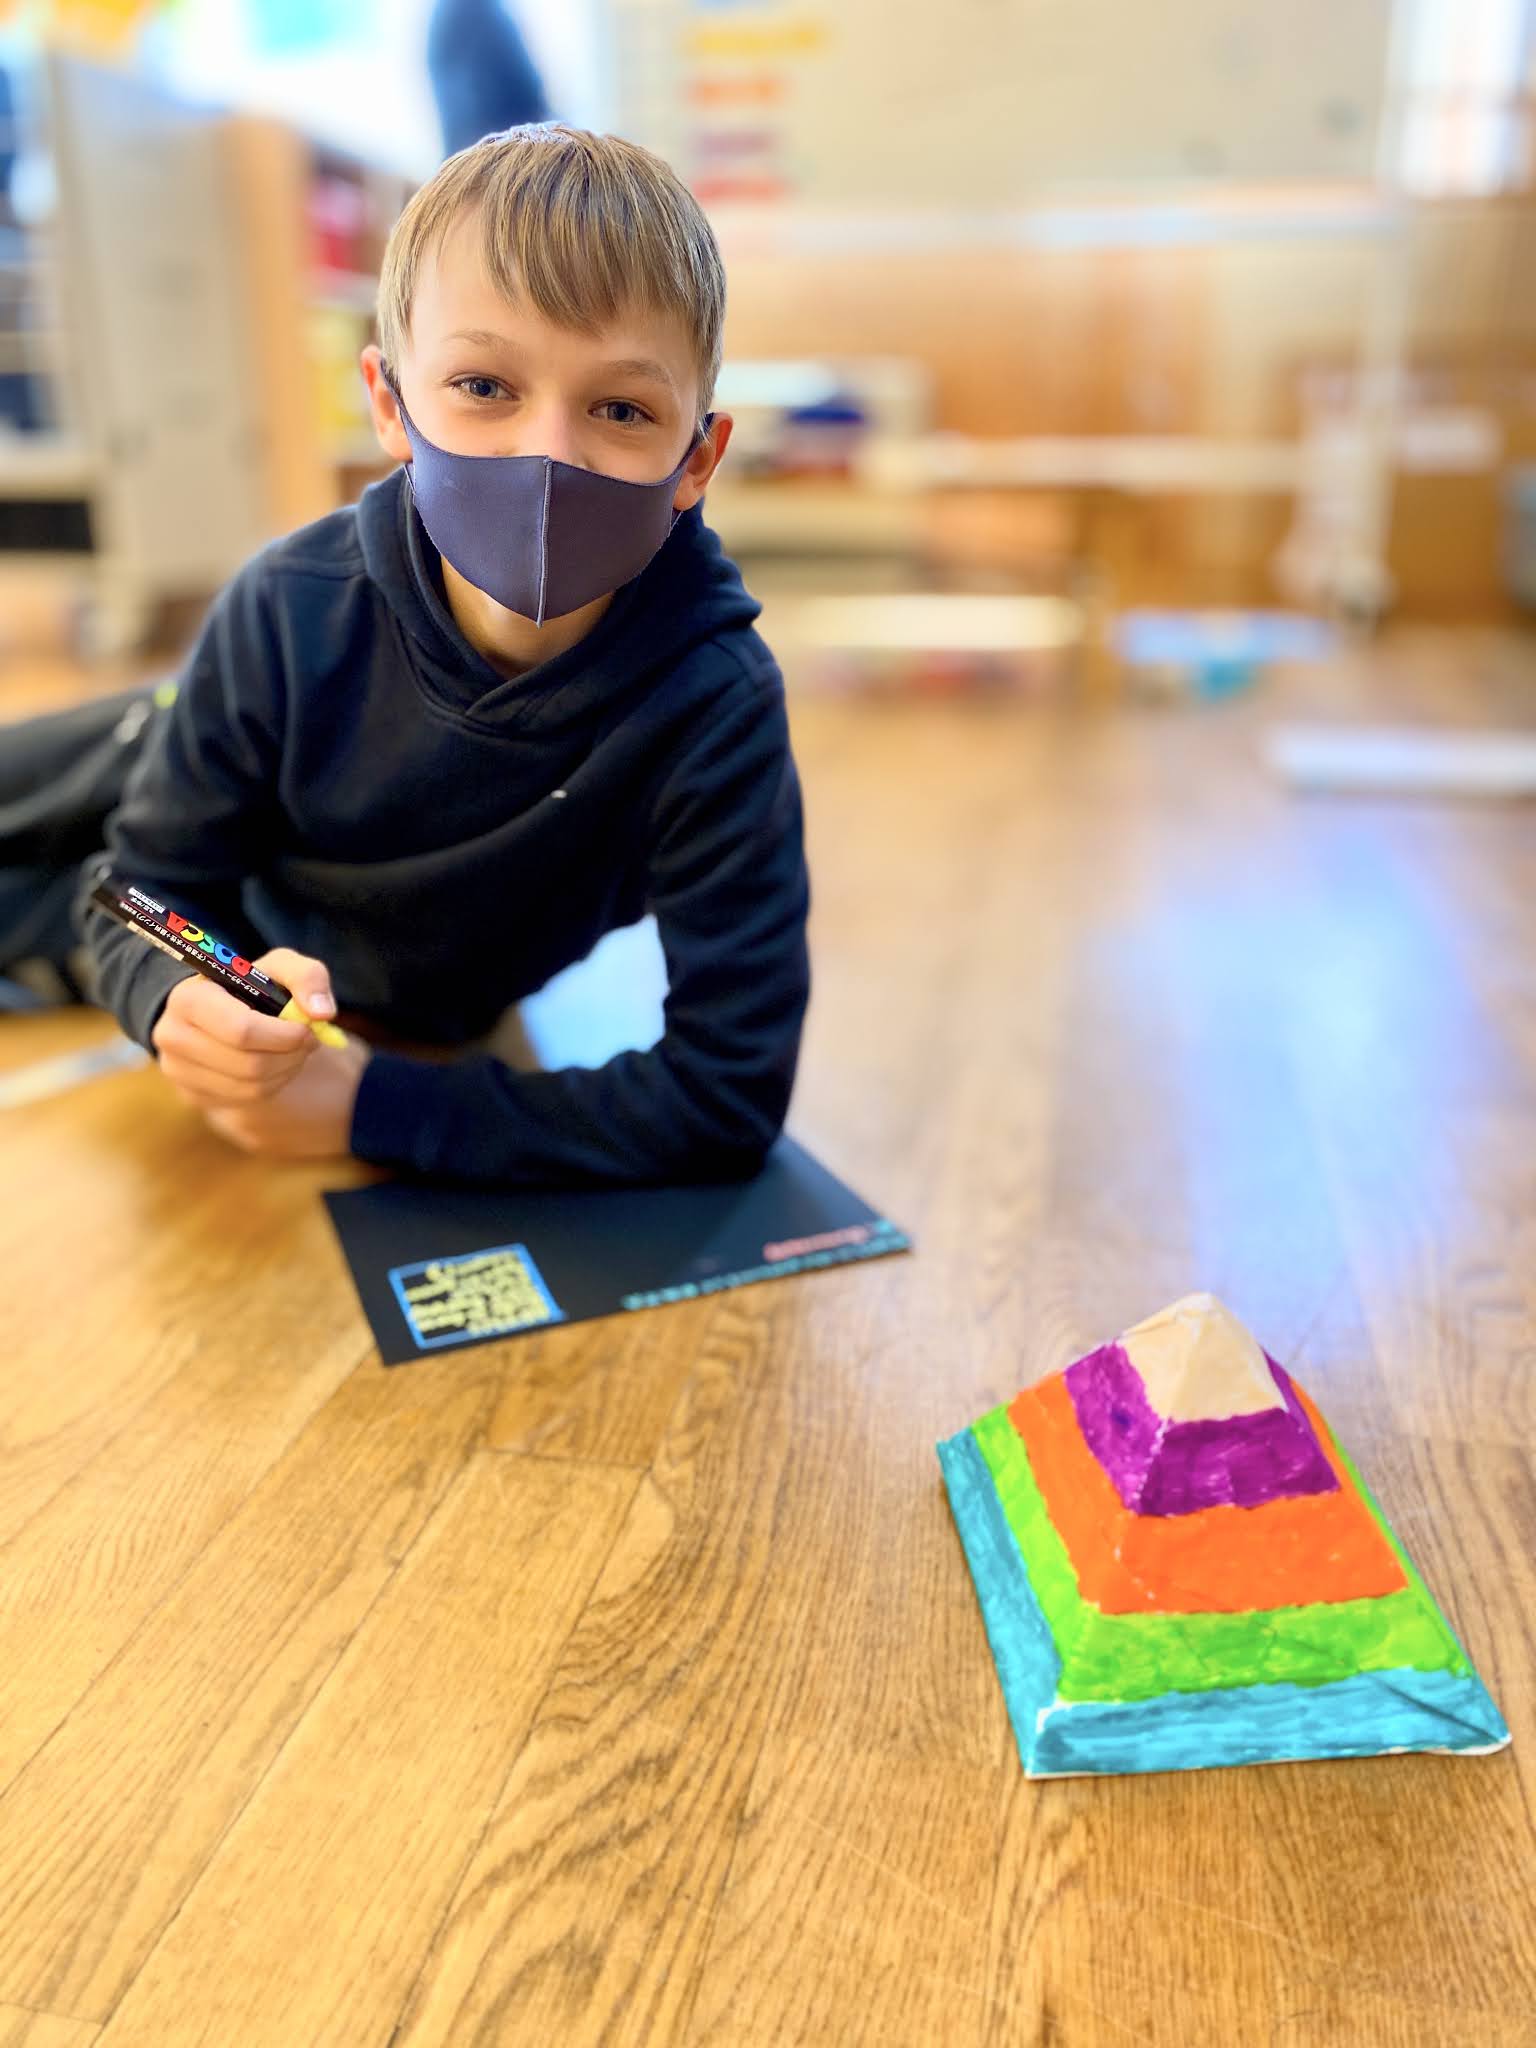
Here, you can see us in our creative process...

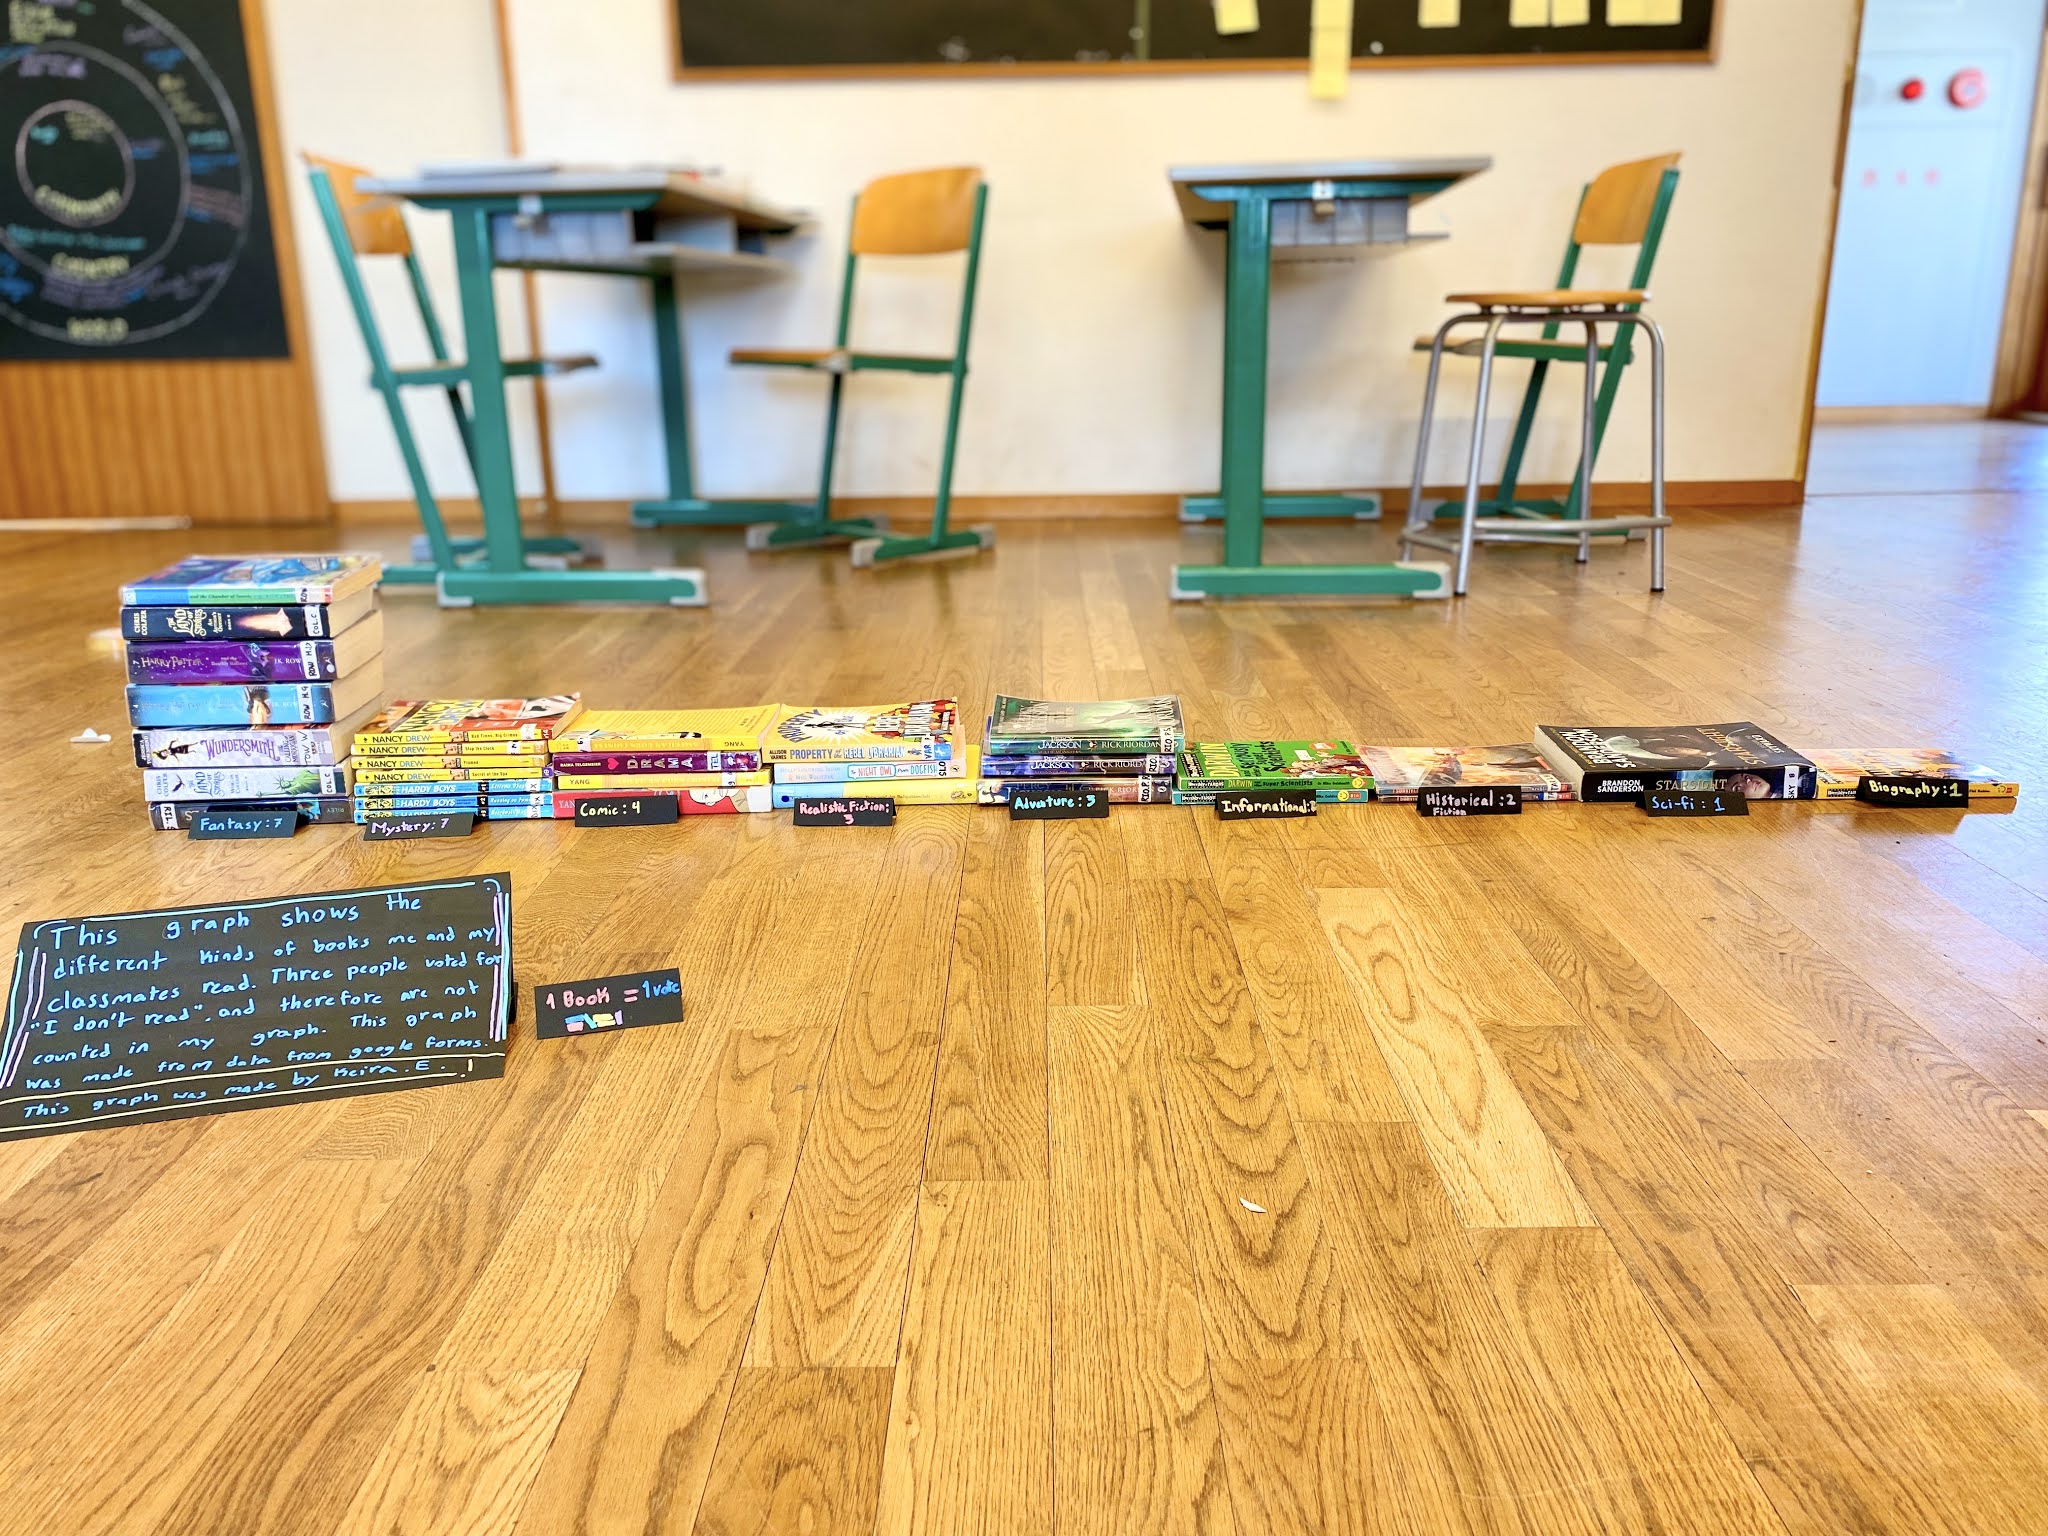
...and some of the completed displays below!


We can't wait to apply the skills we develop through this assignment when we start gathering information in our exhibition!
No comments:
Post a Comment